mirror of
https://github.com/sadoyan/aralez.git
synced 2026-04-30 14:58:38 +08:00
121 lines
3.1 KiB
Markdown
121 lines
3.1 KiB
Markdown
# 📈 Aralez Prometheus Metrics Reference
|
|
|
|
This document outlines Prometheus metrics for the [Aralez](https://github.com/sadoyan/aralez) reverse proxy.
|
|
These metrics can be used for monitoring, alerting and performance analysis.
|
|
|
|
Exposed to `http://config_address/metrics`
|
|
|
|
By default `http://127.0.0.1:3000/metrics`
|
|
|
|
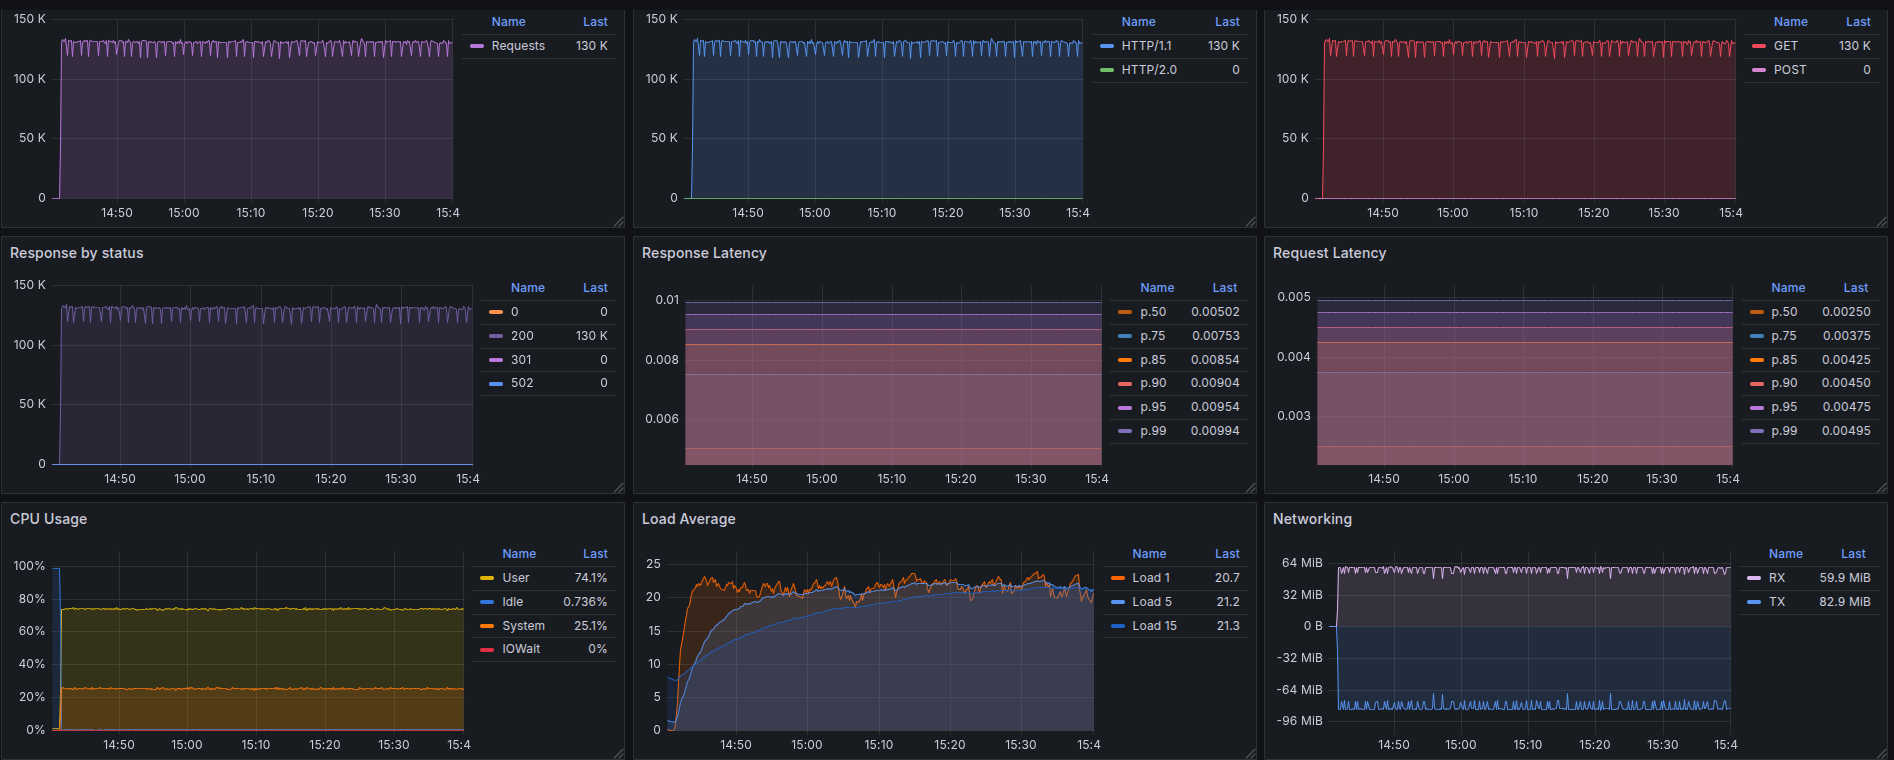
# 📊 Example Grafana dashboard during stress test :
|
|
|
|
|
|
|
|
---
|
|
|
|
## 🛠️ Prometheus Metrics
|
|
|
|
### 1. `aralez_requests_total`
|
|
|
|
- **Type**: `Counter`
|
|
- **Purpose**: Total amount requests served by Aralez.
|
|
|
|
**PromQL example:**
|
|
|
|
```promql
|
|
rate(aralez_requests_total[5m])
|
|
```
|
|
|
|
---
|
|
|
|
### 2. `aralez_errors_total`
|
|
|
|
- **Type**: `Counter`
|
|
- **Purpose**: Count of requests that resulted in an error.
|
|
|
|
**PromQL example:**
|
|
|
|
```promql
|
|
rate(aralez_errors_total[5m])
|
|
```
|
|
|
|
---
|
|
|
|
### 3. `aralez_responses_total{status="200"}`
|
|
|
|
- **Type**: `CounterVec`
|
|
- **Purpose**: Count of responses by HTTP status code.
|
|
|
|
**PromQL example:**
|
|
|
|
```promql
|
|
rate(aralez_responses_total{status=~"5.."}[5m]) > 0
|
|
```
|
|
|
|
> Useful for alerting on 5xx errors.
|
|
|
|
---
|
|
|
|
### 4. `aralez_response_latency_seconds`
|
|
|
|
- **Type**: `Histogram`
|
|
- **Purpose**: Tracks the latency of responses in seconds.
|
|
|
|
**Example bucket output:**
|
|
|
|
```prometheus
|
|
aralez_response_latency_seconds_bucket{le="0.01"} 15
|
|
aralez_response_latency_seconds_bucket{le="0.1"} 120
|
|
aralez_response_latency_seconds_bucket{le="0.25"} 245
|
|
aralez_response_latency_seconds_bucket{le="0.5"} 500
|
|
...
|
|
aralez_response_latency_seconds_count 1023
|
|
aralez_response_latency_seconds_sum 42.6
|
|
```
|
|
|
|
| Metric | Meaning |
|
|
|-------------------------|---------------------------------------------------------------|
|
|
| `bucket{le="0.1"} 120` | 120 requests were ≤ 100ms |
|
|
| `bucket{le="0.25"} 245` | 245 requests were ≤ 250ms |
|
|
| `count` | Total number of observations (i.e., total responses measured) |
|
|
| `sum` | Total time of all responses, in seconds |
|
|
|
|
### 🔍 How to interpret:
|
|
|
|
- `le` means “less than or equal to”.
|
|
- `count` is total amount of observations.
|
|
- `sum` is the total time (in seconds) of all responses.
|
|
|
|
**PromQL examples:**
|
|
|
|
🔹 **95th percentile latency**
|
|
|
|
```promql
|
|
histogram_quantile(0.95, rate(aralez_response_latency_seconds_bucket[5m]))
|
|
|
|
```
|
|
|
|
🔹 **Average latency**
|
|
|
|
```promql
|
|
rate(aralez_response_latency_seconds_sum[5m]) / rate(aralez_response_latency_seconds_count[5m])
|
|
```
|
|
|
|
---
|
|
|
|
## ✅ Notes
|
|
|
|
- Metrics are registered after the first served request.
|
|
|
|
---
|
|
✅ Summary of key metrics
|
|
|
|
| Metric Name | Type | What it Tells You |
|
|
|---------------------------------------|------------|---------------------------|
|
|
| `aralez_requests_total` | Counter | Total requests served |
|
|
| `aralez_errors_total` | Counter | Number of failed requests |
|
|
| `aralez_responses_total{status="200"}` | CounterVec | Response status breakdown |
|
|
| `aralez_response_latency_seconds` | Histogram | How fast responses are |
|
|
|
|
📘 *Last updated: May 2025*
|